Premium Model
Business Expansion (US)This model is focused on a balanced approach, focusing on quality companies from a Universe of stocks with strong growth, and which are expanding their business through acquisitions or other investments.
The model seeks to find market disruptors or companies that are established as the benchmark and leader in their field. This is achieved through a combination of companies that either shows accelerating growth on top line metrics or shows financial metrics for a growing debt while having a solid financial health through a manageable debt-service coverage ratio, and enough quality metrics to support cash flow rate and growth. The list is further filtered through a rank based on quality and discounted price based on estimated growth. The model also consider companies that score the highest on quality and growth to provide better portfolio diversification.
This model has been revised to provide a higher number of holdings (20 stocks), and no market timing, so it can work as an active growth investment alternative.
This is a low-turnover model, and rebalance is done every 4 weeks. It holds up to 15 stocks from a Universe of stocks traded on the US exchanges, mostly mid and large caps.
Some companies are identified through accelerated growth on top line metrics, while others are identified via debt expansion to fund growth. The companies are sorted by metrics to show consistent growth, surprise positive revision, and for the companies that have debt and increasing this debt to fund growth, the rationale is that not all debt is bad:
First, the government encourages businesses to use debt by allowing them to deduct the interest on the debt from corporate income taxes. Second, debt is a much cheaper form of financing than equity. It starts with the fact that equity is riskier than debt. Because a company typically has no legal obligation to pay dividends to common shareholders, those shareholders want a certain rate of return. Debt is much less risky for the investor because the firm is legally obligated to pay it. In addition, shareholders (those that provided the equity funding) are the first to lose their investments when a firm goes bankrupt. Finally, much of the return on equity is tied up in stock appreciation, which requires a company to grow revenue, profit and cash flow. An investor typically wants at least a 10% return due to these risks, while debt can usually be found at a lower rate.
These facts make debt a bargain. It would not be rational for a public company to be funded only by equity. It’s too inefficient. Debt is a lower cost source of funds and allows a higher return to the equity investors by leveraging their money. So why not finance a business entirely with debt? Because all debt, or even 90% debt, would be too risky to those providing the financing. A business needs to balance the use of debt and equity to keep the average cost of capital at its minimum. This metric is called weighed average cost of capital or WACC.
There is a difference between a business growing debt for further expansion, which will reflect in higher earnings and cash flow, versus a business growing debt due to challenges to stay afloat. Using quantitative analysis to ensure that key quality metrics are in place makes the difference maximize success when trading companies that are increasing debt to grow further. This, paired with other metrics on companies that are consistently growing their top line and, and with metrics that demonstrate that businesses are estimated to continue to expand, provides a balanced combination for a growth portfolio.
This is a mechanical model that chooses what to buy and sell based on a set of rules. Therefore, there will be losing trades from time to time. By no means it reflects a broken strategy. No model can outperform at all times, so it’s paramount to have the proper temperament to stick what a strategy that is aligned to your goals and risk tolerance.
This model has been revised to hold up to 15 stocks while not using any market timing. The idea is to make this model an active growth portfolio, rather than a pure trading portfolio. Growth companies shows quick recovery before the market starts to recover, so market timing for this model would lag performance. Therefore, one should have more of an investor mindset (rather than a trader mindset), to ride the volatility in order to be exposed for the full growth potential.
See backtest information below to evaluate how these rules would have worked since 1999:
Model summary, including variable slippage (starting capital was $50,000) and fixed commission of $4.95:

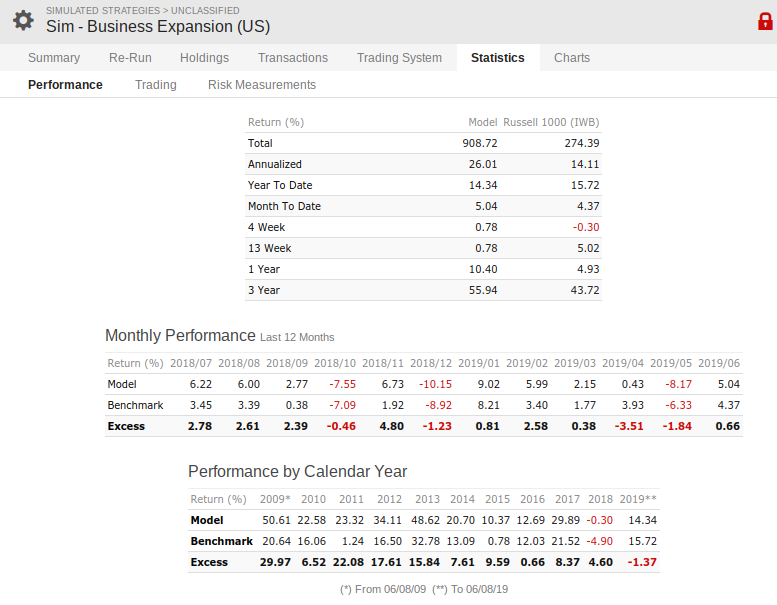
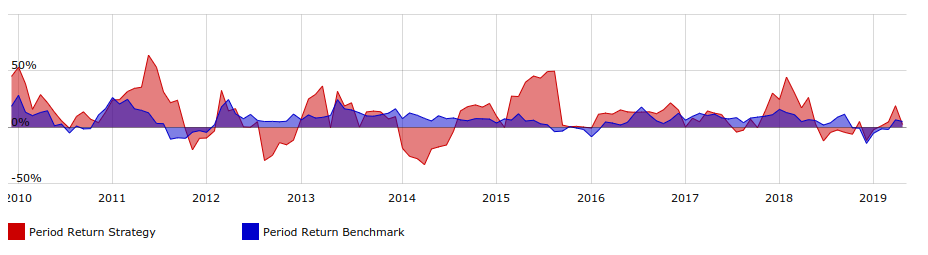
Performance summary:
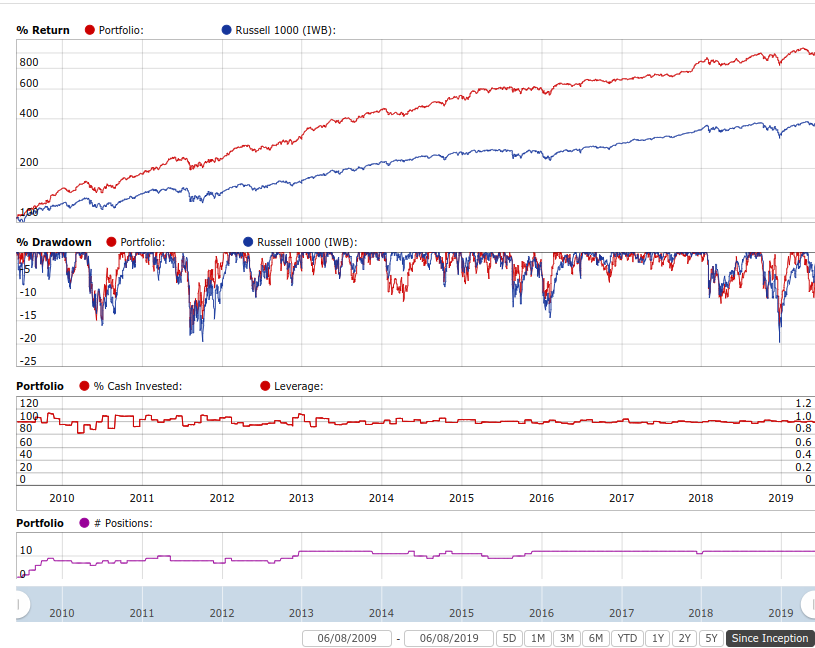
Detailed performance summary which provides max drawdown and % stock invested periods (log scale):
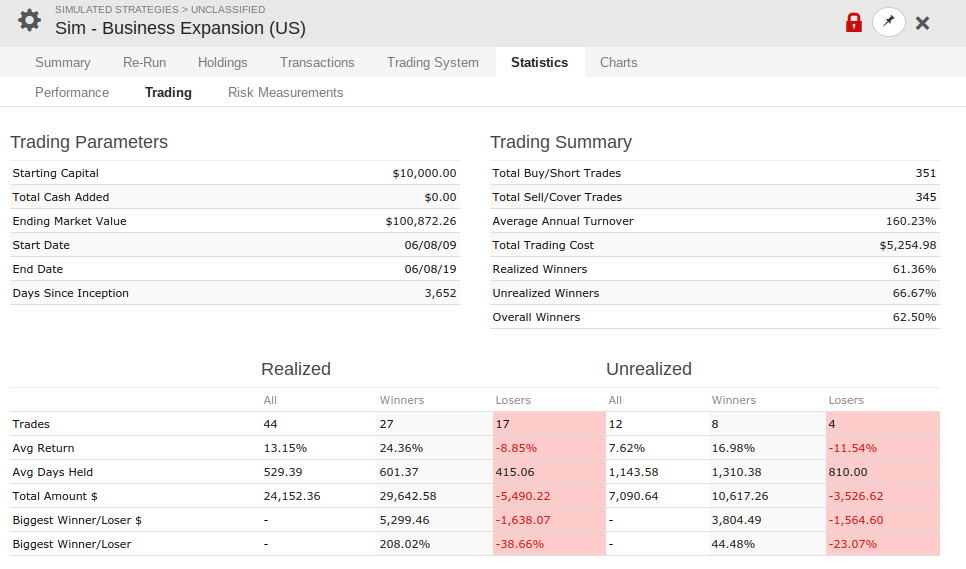
Stats information below, with winners, losers and how long typically these stocks are held for:
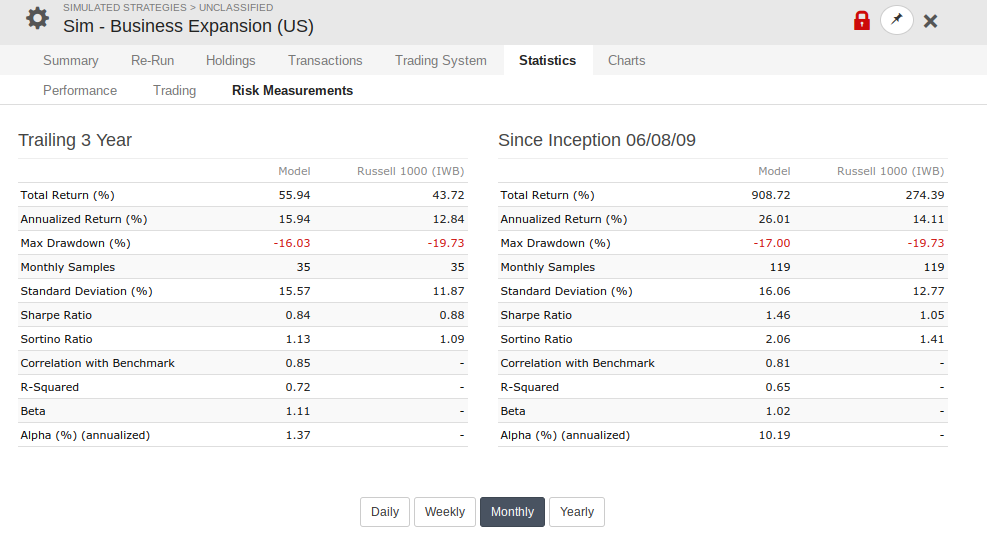
Below are various risk indicators as well:
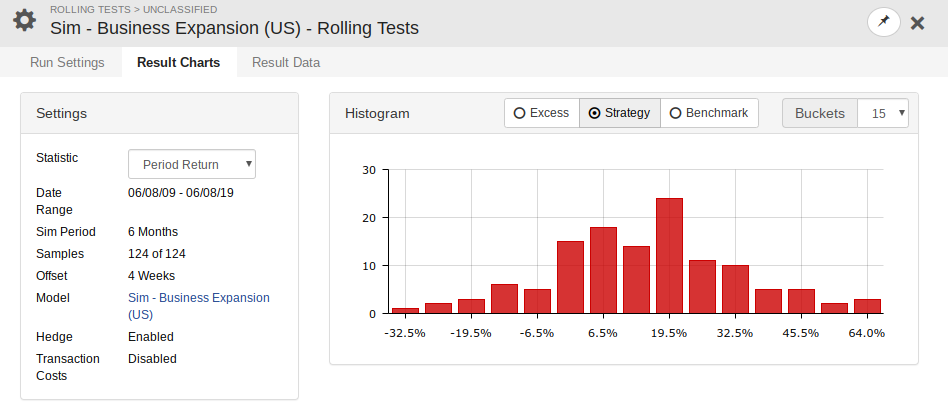
Since the model typically holds positions for 1 month on average, the following histogram was run, to evaluate how consistently the model would perform if it started at different periods (roling offset was set to 1 week, while the performance period was set to 1 month); below is the histogram excess performance when compared to the benchmark (TSX):

And below is the same histogram, but showing the actual model portfolio performance, instead of the excess when compared to the benchmark (Russell 1000 ETF);
The first screening criteria (buying as per the rules of this model) rules narrows down the Universe of mid and large companies from different US stock exchanges that exhibits common metrics to identify growth, such as growing top of the line metrics above peers in the same industry and above the market average. Then the model filters the stocks by liquidity and market sentiment by street upgrades, latest quarterly results, estimates and positive surprise revision. The stocks are then ranked by quality and valuation, looking for consistent growth metrics and results that exceeded market estimates – an indicator that those investment / acquisition synergies are paying off – as well as profitability ratio, projected earnings growth while seeking a stable or lower price to sales ratio.
In order to maximize profit with a lower correlation than other trading models, sell rules are based on technical analysis (momentum decelarating) or fundamentals change (either debt being paid as a sign that most growth has been capitalized or if quality metrics deteriorate).
Subscribe to this model
Interested in subscribing to multiple models? Discounts are available when subscribing to 2 or more models. Simply subscribe to your first model and then let us know which model you want to subscribe next, and we’ll send you a discount coupon.
Discount rates:
| 1st model | full price |
| 2nd model | 10% discount (applied to the 2nd model) |
| 3rd model | 20% discount (applied to the 3rd model) |
| 4th model | 30% discount (applied to the 4th model) |
| 5th model | 40% discount (applied to the 5th model) |
| 6th model | 50% discount (applied to the 6th model) |
| 7th model | 60% discount (applied to the 7th model) |
| 8th model | 70% discount (applied to the 8th model) |
Got questions? Check our Frequently Asked Questions for Premium models or contact us.
Already a member?
Performance Info:
(last updated on June 7, 2026)
Loading Viewer...
Cost of this model: $29 / month. Cancel anytime.
Interested in subscribing to multiple models? Discounts are available when subscribing to 2 or more models. Simply subscribe to your first model and then let us know which model you want to subscribe next, and we’ll send you a discount coupon.
Discount rates:
| 1st model | full price |
| 2nd model | 10% discount (applied to the 2nd model) |
| 3rd model | 20% discount (applied to the 3rd model) |
| 4th model | 30% discount (applied to the 4th model) |
| 5th model | 40% discount (applied to the 5th model) |
| 6th model | 50% discount (applied to the 6th model) |
| 7th model | 60% discount (applied to the 7th model) |
| 8th model | 70% discount (applied to the 8th model) |
Got questions? Check our Frequently Asked Questions for Premium models or contact us.
HELLO.
hope you are well
Graph looks like model beat S&P index but stats dont…so Business model didnt beat S&P? or is this because of recent downturn
thanks!
Hi Sal,
It depends on the period that you are looking at. The model doesn’t attempt to replicate SP500, so it’s not a very good comparison. The model is based on expansion of businesses through debt. It provides a different dynamic than SP500, which was very overvalued (many ETFs or funds underperformed SP500, which kept getting more and more overvalued, hence it can’t be compared to a model that was constructed through different rules other than market cap).
The model beat SP500 in 2018. But it performed slower than SP500, hence a lagging graph, although it was still higher than the market due to outperformance from 2018. The model had a steady growth (although slower than SP500 due to recent overvaluation) until January 2020, where it got severely affected, like most stocks. This model is also hedged now, since the market timing formula is signaling a recession soon (and historically it was always prudent to stay in fixed income until businesses start to improve guidance). Earnings season start this coming week, which should give the first update to these signals.
So the stats reflect the same data from the graph, the difference is that the graph is shown since inception while the stats are per month (for the last 12 months) and per year.
Debt is cheap (and I expect to continue cheap with such low interest rates), so I expect the model to outperform again the future.
Please let me know if you have any questions.
Rod