Premium Model
Earnings and Dividend Growth (Canada)This model provides a balanced approach focused on Earnings Growth and Dividend Growth, as well as companies with a tracking record of meeting or exceeding estimates as well as being estimated to grow. Furthermore, the model chooses stocks with a history of low volatility, which tends to be stable and predictable regarding earnings estimates.
Stocks estimated to deliver strong growth are the first to be penalized when they don’t meet expectations or when the market starts getting nervous, so market timing rules are enabled to mitigate market risks associated with a market crash due to recession.
This is a low turnover model, and rebalance is done at every 4 weeks. It holds up to 10 stocks. It only contain stocks from TSX (so no Venture Exchange stocks). A small revision was made to this model in July 2020, and the model only consider stocks that are mid, large and mega market cap. Another revision was made in May 2024 to incorporate improved metrics on price to sale and shareholder yield.
The idea is to initially filter stocks by Quality first, and then ranking them by dividend growth and low volatility aspects. Companies that have a tracking record of meeting or exceeding results, and that show low volatility via a normalized average true range over a quarter, and that are estimated to grow, have shown to outperform as the company continues to deliver on what was promised and the market continues optimistic as these company haven’t disappointed. A stock is sold when momentum stalls, measured by different technical analysis metric. Rebalancing on weight distribution according to volatility is done at every 4 months. Regarding the enhancement on shareholder yield: Shareholder yield is a return measure that compares the company’s cash and non-cash distributions to its market value. The ratio is calculated by adding the dividend yield to the buyback yield, which is calculated as the negative of net equity issuance divided by market capitalization. All else being equal, the lower the ratio, the less attractive a company is as an investment because it indicates that investors are putting money into the company but not receiving a good cash return in exchange. This ratio provides a more accurate representation of return to the shareholder than the dividend yield because it includes all distributions (and dilutions) for the shareholders.
This is a mechanical model that chooses what to buy and sell based on a set of rules. Therefore, there will be losing trades from time to time. By no means it reflects a broken strategy. No model can outperform at all times, so it’s paramount to have the proper temperament to stick what a strategy that is aligned to your goals and risk tolerance.
See backtest information below to evaluate how these rules would have worked since 1999:
Model summary, including variable slippage (starting capital was $50,000) and fixed commission of $4.95:
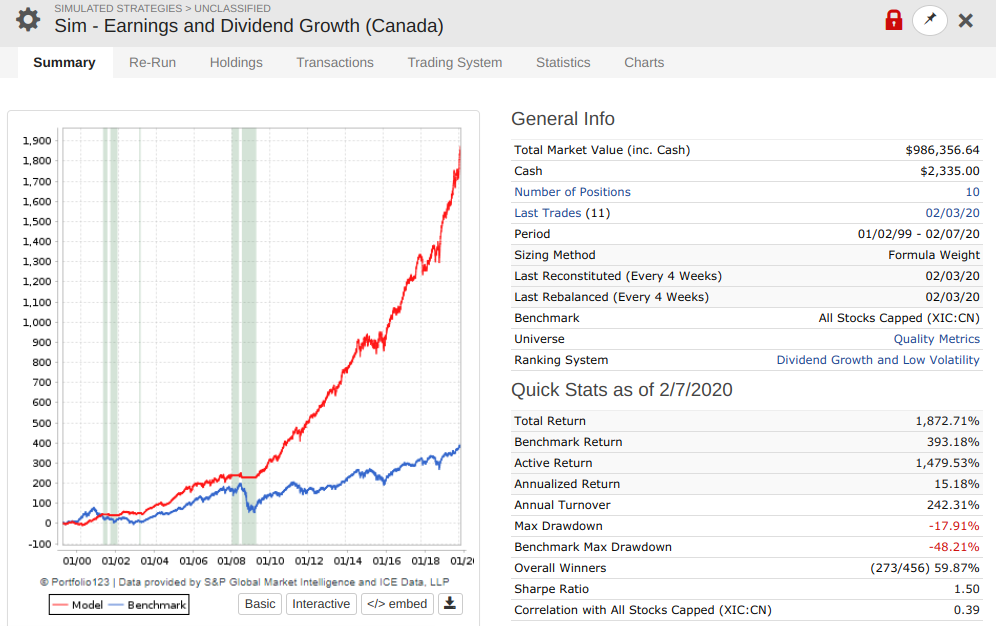
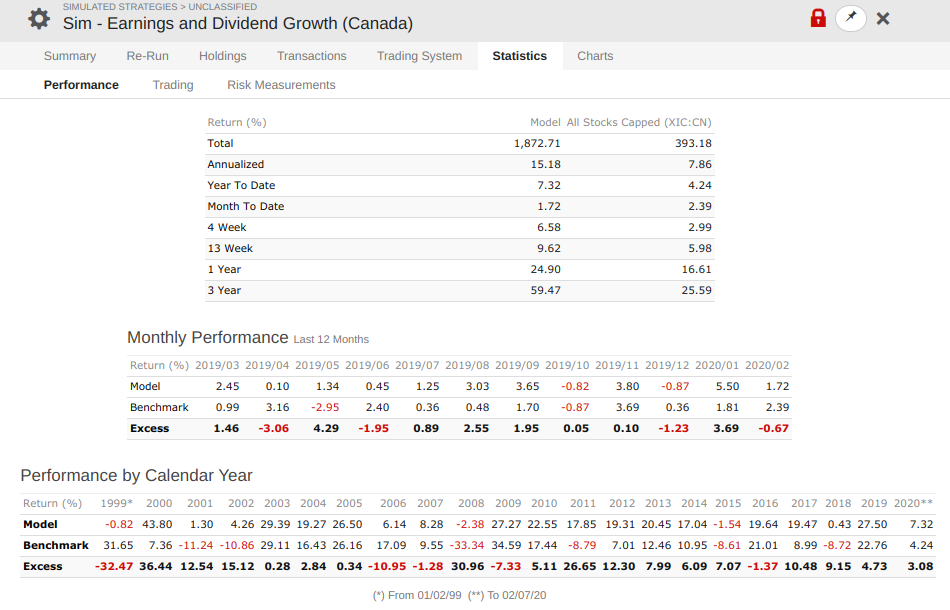
Performance summary:
Detailed performance summary which provides max drawdown and % stock invested periods (log scale):

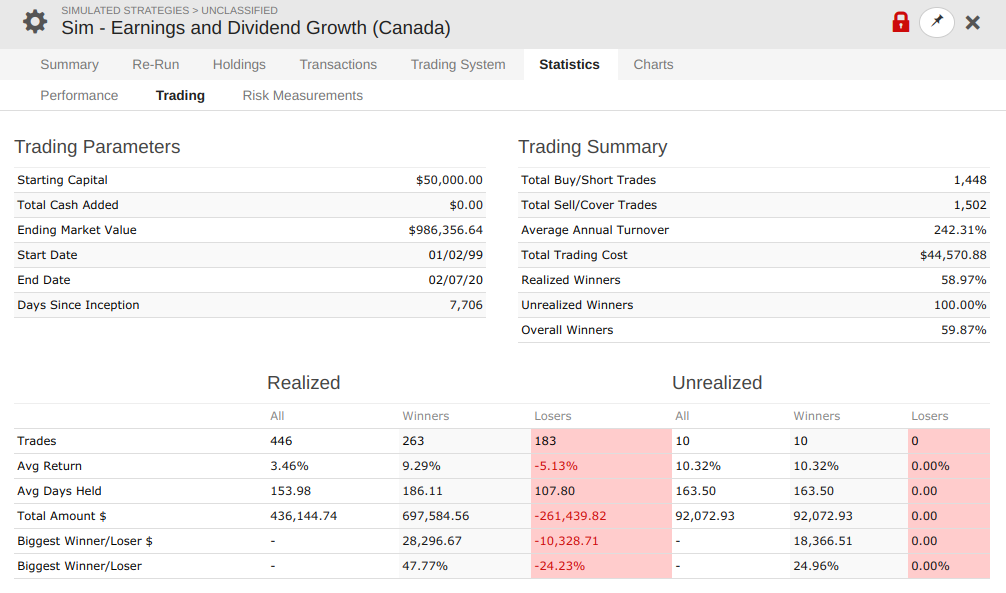
Stats information below, with winners, losers and how long typically these stocks are held for:
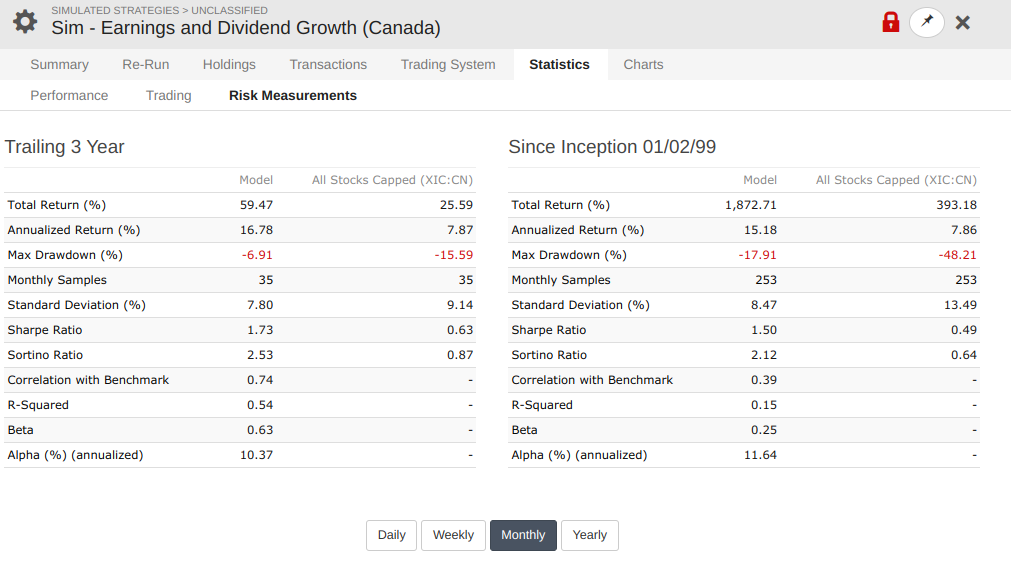
Below are various risk indicators as well:
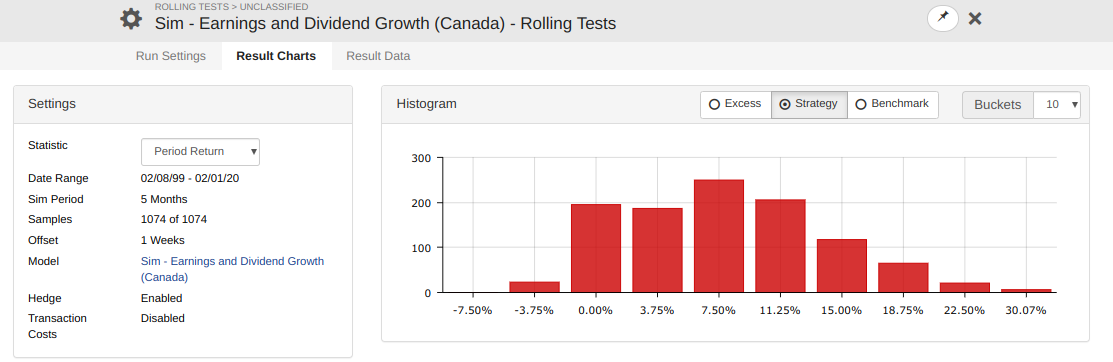
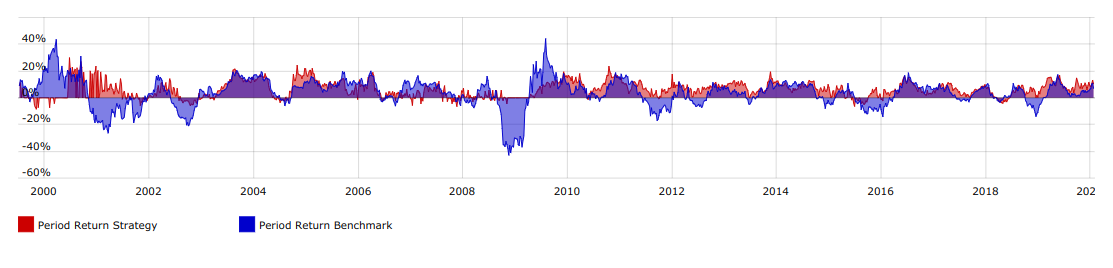
Since the model typically holds positions for 5 months on average, the following histogram was run, to evaluate how consistently the model would perform if it started at different periods (roling offset was set to 1 week, while the performance period was set to 5 months); below is the histogram excess performance when compared to the benchmark (TSX):

And below is the same histogram, but showing the actual model portfolio performance, instead of the excess when compared to the benchmark (TSX);
The first screening criteria is related to the market timing, to either be in equities or cash. This market timing rules use data from micro-elements (earnings and price movement trends for the whole market) as well as macro-elements, such as economic indicators (which might drive prices lower, regardless of solid fundamentals) to issue a sell all signal (move to cash) or buy according to the rules of this model.
The next screening criteria (buying rules as per the rules of this model) narrows down the Universe to stocks with established quality metrics, using earnings, cash flow, return on investment, estimated growth, price to sales and shareholder yield by choosing the top quintile of the ranking system. Then, further screening takes place to ensure that:
- Companies pay a reasonable dividend and have increased dividend in the last year;
- Companies are sorted by the highest earnings growth on the last 3 years;
- Companies are part of mid, large or mega market cap to ensure liquidity;
Once a list of stocks are found, then they are ranked from best to worse, where only the top ranked are chosen. The ranking is based on weighted metrics for dividend growth and low volatility through normalized true average range.
A stock will be sold if momentum deteriorates for a given stock, based on technical analysis for price and relative strength, or if market timing rules activates to switch to fixed income.
Subscribe to this model
Interested in subscribing to multiple models? Discounts are available when subscribing to 2 or more models. Simply subscribe to your first model and then let us know which model you want to subscribe next, and we’ll send you a discount coupon.
Discount rates:
| 1st model | full price |
| 2nd model | 10% discount (applied to the 2nd model) |
| 3rd model | 20% discount (applied to the 3rd model) |
| 4th model | 30% discount (applied to the 4th model) |
| 5th model | 40% discount (applied to the 5th model) |
| 6th model | 50% discount (applied to the 6th model) |
| 7th model | 60% discount (applied to the 7th model) |
| 8th model | 70% discount (applied to the 8th model) |
Got questions? Check our Frequently Asked Questions for Premium models or contact us.
Already a member?
Performance Info:
(last updated on July 12, 2026)
Loading Viewer...
Cost of this model: $32 / month. Cancel anytime.
Interested in subscribing to multiple models? Discounts are available when subscribing to 2 or more models. Simply subscribe to your first model and then let us know which model you want to subscribe next, and we’ll send you a discount coupon.
Discount rates:
| 1st model | full price |
| 2nd model | 10% discount (applied to the 2nd model) |
| 3rd model | 20% discount (applied to the 3rd model) |
| 4th model | 30% discount (applied to the 4th model) |
| 5th model | 40% discount (applied to the 5th model) |
| 6th model | 50% discount (applied to the 6th model) |
| 7th model | 60% discount (applied to the 7th model) |
| 8th model | 70% discount (applied to the 8th model) |
Got questions? Check our Frequently Asked Questions for Premium models or contact us.
0 Comments