
On this post I will explain the rules to screen the companies that meet my goals from a quality and valuation perspective and choose the best ones among the stocks from the TSX and US Exchanges. This is typically used as an initial quantitative analysis only, so I can do a qualitative analysis later myself.
This stage is to build or review my watchlist, therefore the main focus is on what to buy (which says nothing about when to buy). The focus on what to buy starts with the quality of the business. And the primary determinant of high quality is superior financial strength. Financially strong companies possess the staying power and resources to weather the occasional bad storms that will inevitably occur. Every business will on occasion face challenges and difficulties. Meeting those challenges requires a strong balance sheet and an adaptive and competent management team to guide the company across troubled waters.
Regarding safety considerations, cash flows are more relevant than earnings. Because when it comes to the survival of a business, cash flow is king. As it relates to safety, a business surviving as an ongoing concern is the last line of defense.
Regarding dividends, it’s important to consider the dividend payout ratio to operating cash flow ratio, and not just earnings (many financial websites shows the payout ratio related to earnings instead of cash flow). Dividends don’t come from EPS! They come from cash and cash only. What if all your sales were reflective in accounts receivables and all receivables turned out to be uncollectible? You would show positive EPS assuming expenses were lower than revenue. Revenue is not all cash! It is expected cash in the future. You can literally have positive EPS and can go bankrupt.
My long term investing strategy is based on dividend growth, so it can provide me with growing income perpetually, regardless of market fluctuation. This is only possible with high quality companies. Investing in quality blue-chip dividend growth stocks is not about how much their stock price might appreciate. Instead, it’s about their safety and how much dividend income and dividend income growth they can provide long into the future. However, this is not to suggest that they do not possess the capacity for capital appreciation, because they all do. This is especially true if they are purchased at sound or attractive valuations.
Therefore, my first screening rule is about dividend growth. A company must have increased dividends for at least 5 consecutive years. I’m ok to keep holding a company that might pause that growth, as not every company can grow dividends every single year, but I will only add a new company to my list if it has a dividend growth prospect that they were able to maintain for the last 5 years.
My second screening rule is to consider only stocks that ranks higher than 50% on my quality ranking. Quality is an important category of factors, but not necessarily one that exhibits its importance in a style-focused ranking system aimed at top performance among best ranked stocks. Quality-related share price performance will also be impacted by value (whether or not one overpays for quality) and trend (improving quality will likely trump deteriorating quality). It may also have industry-specific flavors (i.e. depending on the nature of the business, high leverage might be a plus or a minus). But for a style-specific quality ranking system, it has a good usage in pruning losers (i.e. eliminating lower ranked buckets) from a model than zeroing in on winners. My quality ranking is built with the following criteria:
25% weight on Margins:
- 75% weight for Operating Margin %: This value measures the percent of revenues remaining after paying all operating expenses. It is calculated as operating Income divided by Total Revenue for the period expressed as percentage. Operating Income is defined as Total Revenue minus Total Operating Expenses.
- 25% 5-year average Operating Margin %: This value measures the percent of revenues remaining after paying all operating expenses. It is calculated by first determining the Operating Margin for each of the last 5 fiscal years and then averaging the values.
25% weight on Asset Turnover: This value is calculated as the Total Revenues divided by the Average Total Assets for the same period.
25% weight on Return of Capital:
- 30% on ROI%: This value is the trailing twelve month Income After Taxes divided by the average Total Long Term Debt and Stockholders Equity, expressed as a percentage. Average Total Long Term Debt and Stockholders Equity is the average at the beginning and the end of the period.
- 40% on 5-year average ROI%: The 5-year average using the ROI% calculation above for each period.
- 10% on ROE%: This value is calculated as the Income Before Extraordinary Items for the period divided by the Average Common Equity and is expressed as a percentage. Average Common Equity is the average of the Common Equity at the beginning and the end of the period.
- 20% on 5-year average ROE%: The 5-year average using the ROE% calculation above for each period.
25% weight on Finances metrics:
- 30% on current ratio: This is the ratio of Total Current Assets for the period divided by Total Current Liabilities for the same period.
- 45% on interest coverage: Also known as Times Interest Earned, this is the ratio of Earnings Before Interest and Taxes for the trailing twelve months divided by the trailing twelve month Interest Expense. Please note that this item is not applicable for banks and insurance companies.
- 25% on Debt to Capital ratio: This ratio is Total Debt divided by Total Capital. Total Capital is the sum of Short Term Debt, Current Portion of Long Term Debt, Long Term Debt, Capitalized Lease Obligations and Total Stockholder’s Equity.
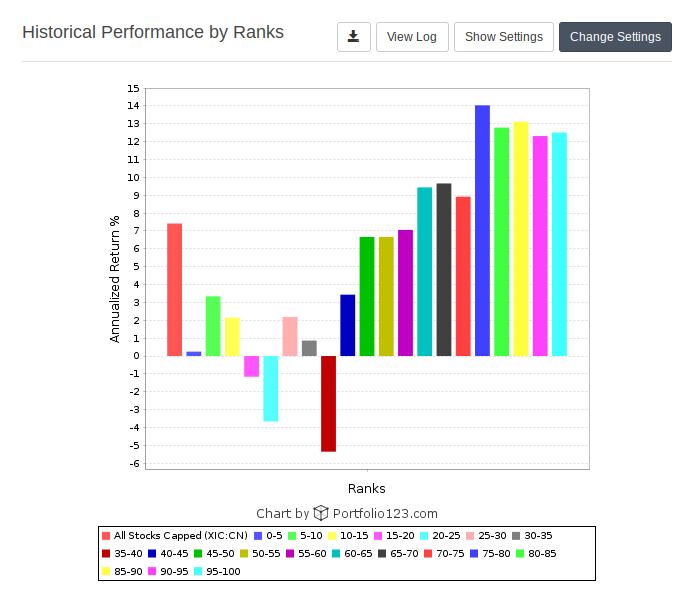
The graph below shows how companies that are ranked in the upper half of the rank performs better than the lower half. The graph below has data since 1999, for all stocks in the Toronto Stock Exchange, and it was rebalanced at every 6 months:
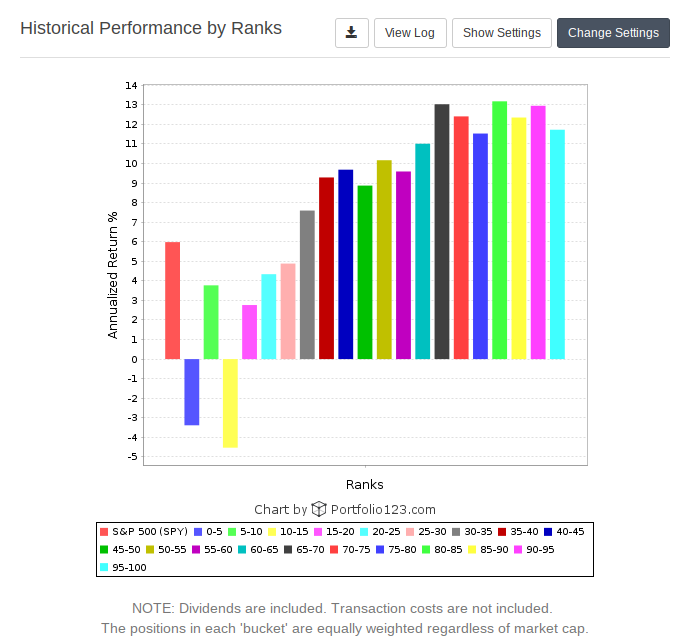
A similar graph can be seen for the stocks in NYSE:
Then, my next screening rule is to consider only stocks that ranks higher than 70% on my value ranking. Valuation is as important as quality: buying a good company at an expensive price can be a bad investment. The better the valuation, the higher the margin of safety; when we purchase stocks, we’re actually buying the business’s earnings potential, so if that earnings doesn’t materialize, valuation allows losses to be mitigated, when compared if the stock was overvalued.
My valuation ranking is built with the following criteria:
65% weight on Income Stream:
- 50% based on Earnings Income:
- 33.3% driven by Price To Earnings Ratio, Excluding Extraordinary Items;
- 33.3% driven by Current Fiscal Year Projected P/E Ratio;
- 33.4% driven by Projected Price/Earnings to Long Term Growth Rate.
- 50% based on Other types of Income:
- 50% driven by Price to Sales Ratio;
- 50% driven by Price To Free Cash Flow Per Share Ratio
35% weight on Assets, based on Price to Book ratio.
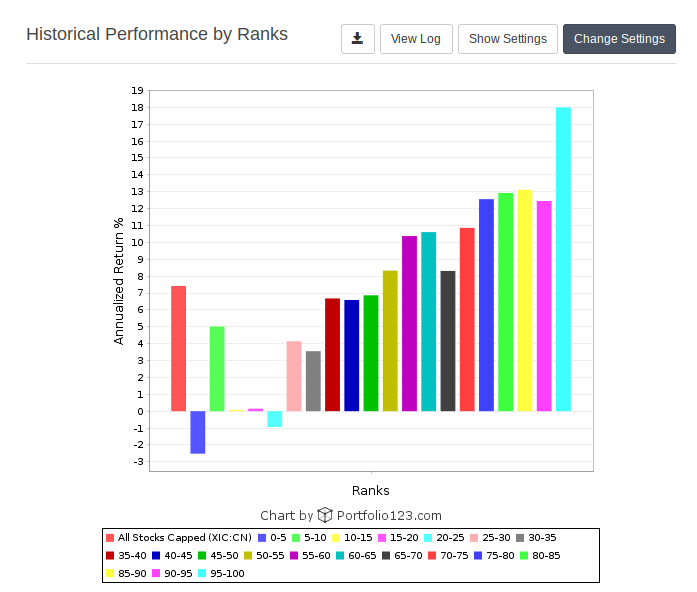
The graph below shows how companies that are ranked in the upper half of the rank performs better than the lower half. The graph below has data since 1999, for all stocks in the Toronto Stock Exchange, and it was rebalanced at every 6 months:
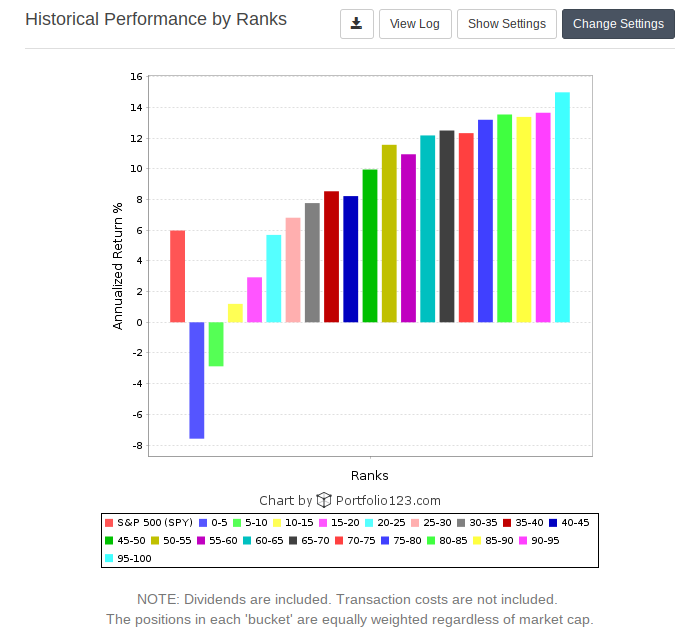
A similar graph can be seen for the stocks in US Exchanges:
My last screening rule is to retrieve stocks that have a history of not being more volatile than the market; given that the primary focus is the safety of dividends, volatility can have underlying reasons that goes beyond what this initial quantitative process can screen for, so I rather be on the safe side and examine other details behind price performance to ensure that there is supporting data for that stability. To do that, I will screen for beta lower than 80%. Beta is known as a measure of the volatility, or systematic risk, of a security or a portfolio in comparison to the market as a whole. Beta is calculated using regression analysis, and you can think of beta as the tendency of a security’s returns to respond to swings in the market. A beta of 1 indicates that the security’s price will move with the market. A beta of less than 1 means that the security will be less volatile than the market. A beta of greater than 1 indicates that the security’s price will be more volatile than the market. For example, by looking for a stock’s beta of 0.8, it’s theoretically 20% less volatile than the market.
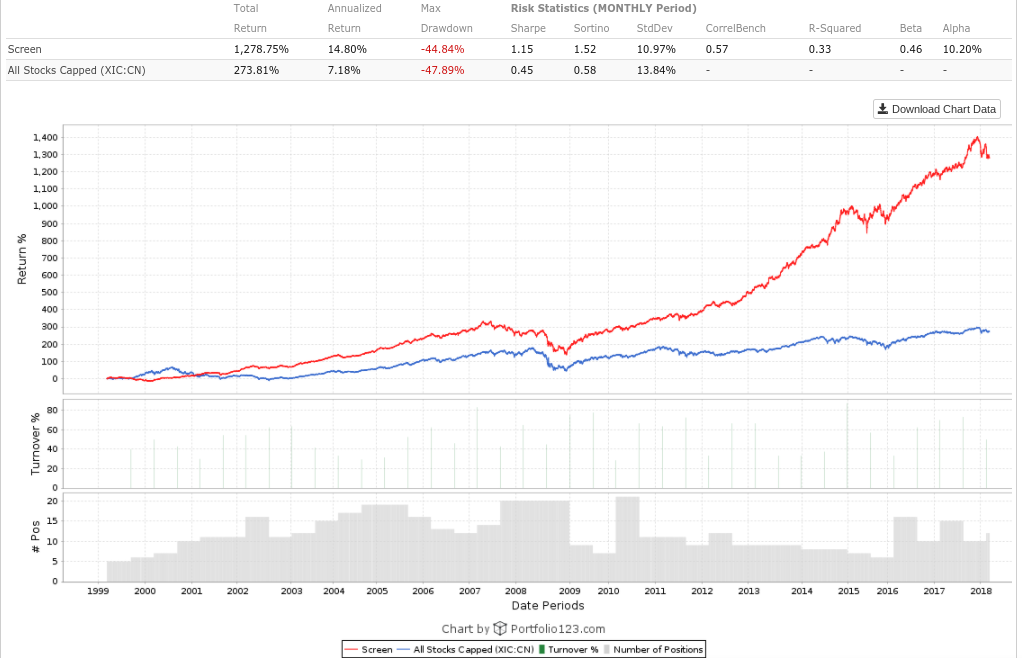
The end result is a manageable list, that allows me to do further qualitative research, similar to the process when I posted how I evaluated Blackrock. This very process, applied since 1999, twice a year, indicates how powerful these rules based on dividend growth, quality and valuation can be:
Backtest performance for Canadian stocks:
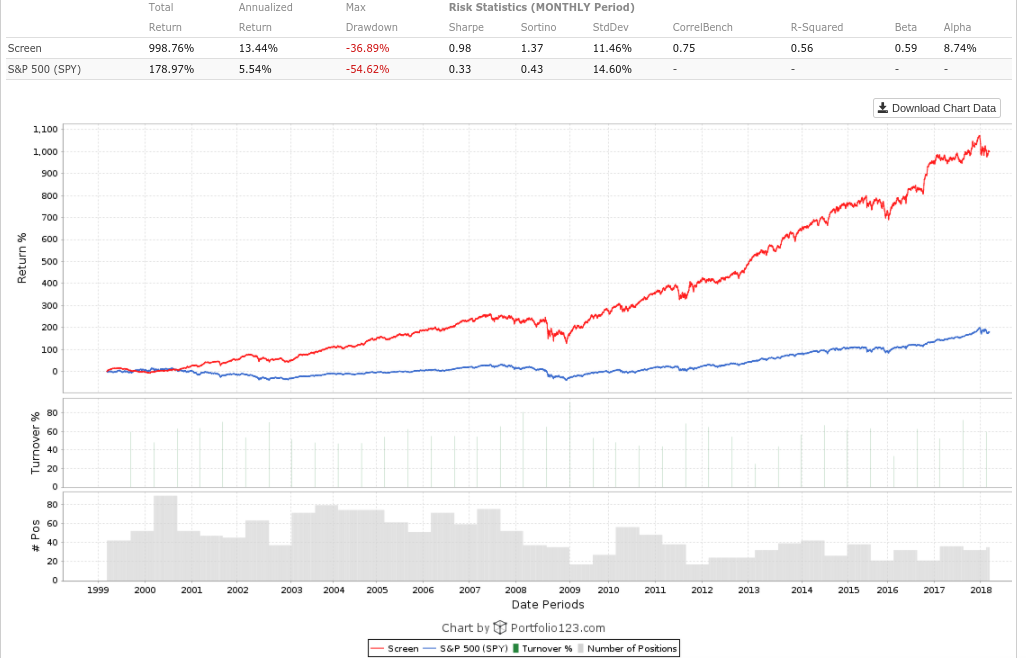
Backtest performance for US stocks:
Here is a list with the stocks that were found through this process, on both Canadian and US exchanges. I plan to run this screening process every 6 months, on April and October.
Not every sector can be covered with the methodology above – for example, the technology sector is known for using other metrics regarding quality and valuation, but the list above gives an idea of the overall process, and how a good screener can optimize the construction of a robust portfolio for dividend growth based on quality and valuation.
Happy Investing!
Any update on your screener for October?
Yes, I’ll be posting an update in a few days. There has been some changes in portfolio123, and I have to change how the reports get generated.
Nice Post !!
Hi Rod,
Nice post on explaining your thought process of how to screen for quality companies at an attractive valuation. I guess my next question is that if you are looking to buy into some of these companies on your watchlist, would you have a different criteria of evaluating when to buy/sell your stock (different from your other models – either the trading or Dividend growth model) as I would guess this would have a different goal from those 2 portfolios? Since it would be updated twice a year, would it be suitable for a long term type of investing strategy (as opposed to a weekly or monthly rebalance)?
Also, will there be a future blog post explaining how one would begin (assuming they would use a watchlist like this) how to begin investing – i.e would you focus on buying a few companies at once, across many industries, or would you only start buying companies which are fairly or undervalued.
Thanks in advance for your comment – I enjoy reading a lot of your articles 🙂
Thanks for the kind words. The companies on my watchlist (which are meant for Dividend Growth Investing) have other qualitative criteria that cannot be represented with the quantitative screening above. Therefore, the quantitative screening is just a starting point to later research if I want to partner with these business for a long time. From this perspective, the end-goal are the partnership with the business and the screening list is just an initial list. A very different mindset is the trading approach (or short term investing approach), even with a longer period that only rebalances twice a year. In that case, the end-goal is to lock profits for the short term and minimize drawdown, so the end-goal is the list (which determines what to buy and sell) and the companies are mere tickers. Following a mechanical model (regardless the rebalance period) means that it’s solely done based on quantitative factors. That’s why several companies are sold and others are bought at every 6 months.
So from an investing perspective, this list can be used as a starting point where further research is required to make a decision to partner with a business for many years to come; one wouldn’t sell it if they had a bad quarter or bad year, hence the qualitative aspect needs to be researched.
From a trading perspective, or a short-term investing perspective, this list can be used to build a portfolio that only rebalances twice a year, where stocks would be bought and sold based on the presence or absence of the factors described on the screener. We know that quality and valuation drives superior adjusted risk return overtime, so this could be a form of investing (the same way that indexing works like a slow-active trading model that buys and sells stocks based on market cap).
There are many ways to implement it, and I’ll consider writing a few posts exploring some of these ideas. To implement it as a portfolio, one needs to define how many positions the portfolio will hold. One approach is to allocate the highest ranked with a reasonable sector distribution (I wouldn’t allocate more than 30% to a single sector). Another approach might consider researching the most undervalued ones. Another approach might consider buying the ones with highest yield to have the highest income to spend or reinvest.
Please let me know if you have any questions.
Hi Rod,
Your attention to detail and consistently disciplined mindset and analyses are very admirable, and I appreciate you taking the time to share your thought process.
I have a clarification question about the backtest performance charts posted – do these backtests model what would happen if at every 6-month interval, the holdings that met all criteria were all sold and equal amounts of each of the stocks on the latest list were purchased?
If not, how is the backtest balanced and how are proportions of each of the stocks that meet the criteria determined?
Thanks
Thanks for the kind words. Correct, the positions are all sold and it holds equal amounts across the portfolio, for a balanced weight. Notice the graph below that if a stock is sold and it’s deemed to be purchased again, then it doesn’t show as a new position. The sold positions are the ones that are sold and not repurchased, and the new positions are brand new additions. The total number of positions varies as different companies meet the criteria. See the transaction details below for each rebalance period:
Click on this link to open the transactions on a new tab
Rod