Premium Models
Nasdaq and NYSE Leaders (US)This model seeks companies with strong fundamentals, momentum and growing top line estimates, from a niche of companies focused on innovation, new technology and leadership among peers in the same industry. While innovation can’t be mathematically modeled, several formulas and rankings were built to choose only the top companies that score well on both fundamentals and technical analysis. Growth stocks are the first to be penalized when they don’t meet expectations or when the market starts getting nervous, so market timing rules are enabled to mitigate market risks associated with a market crash due to recession.
This model has been revised in February 2023 to adjust rules regarding valuation, debt and quality. This is a medium turn-over model, and rebalance is done weekly. It holds up to 7 stocks, from an Universe originally made of innovative companies listed on NASDAQ and NYSE Exchanges. The idea is to capture companies that are not only disrupting the market, but are also rapidly growing, while demonstrating strong fundamentals principles and awareness on valuation (to reduce risks regarding premium valuation due to growth). Due to the growth velocity of these companies, most or all are estimated to outperform the competition on fundamentals metrics in the same industry are likely to reflect that growth in the stock price. In order to evaluate how these companies are faring with competitors, the metrics are compared with peers in the same industry. Since momentum laws suggests that a company can continue to outperform even if it’s overvalued, technical analysis is used to confirm momentum strength and to take action to sell if fundamentals deteriorate or if momentum slows down. Latest revision include further improvements regarding valuation and quality metrics.
In parallel to the rules above, the model is also hedged with an ETF taking momentum into account to further leverage or control risk exposure.
The revision to add more stocks on this portfolio helps to increase diversification, and provide broader exposure to companies from different niches. This is a mechanical model that chooses what to buy and sell based on a set of rules. Therefore, there will be losing trades from time to time. By no means it reflects a broken strategy. No model can outperform at all times, so it’s paramount to have the proper temperament to stick what a strategy that is aligned to your goals and risk tolerance. See backtest information below to evaluate how these rules would have worked since 1999: Model summary, including variable slippage (starting capital was $50,000) and fixed commission of $4.95:
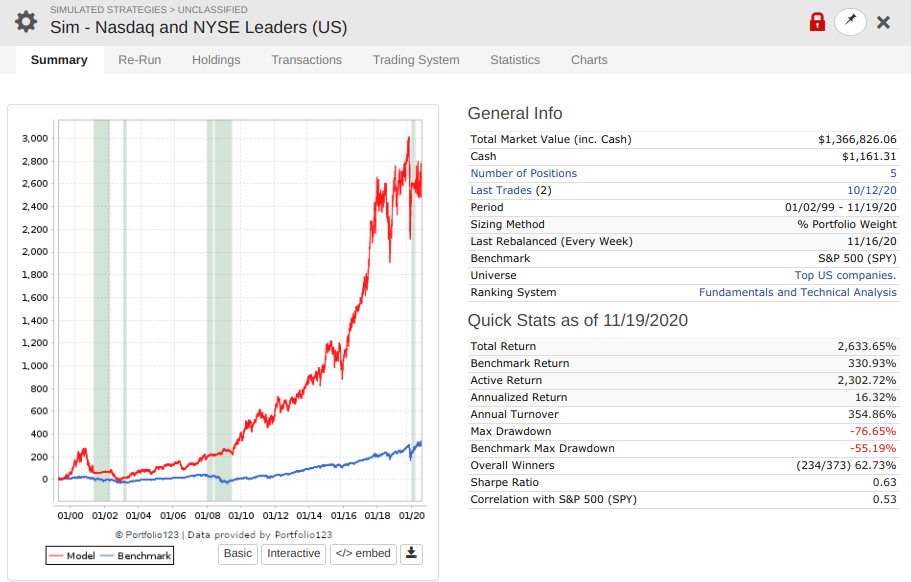
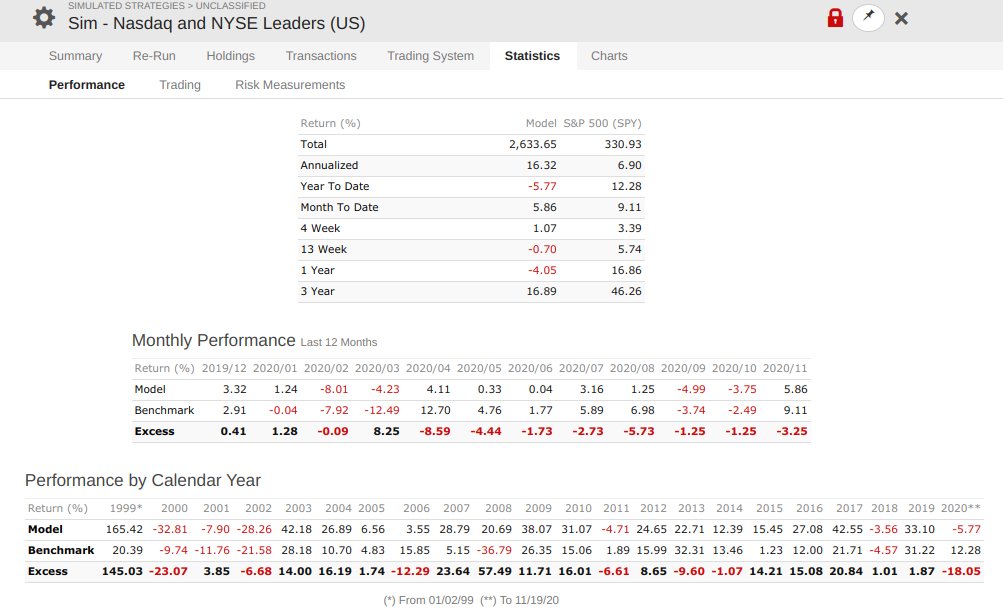
Performance summary:
Detailed performance summary which provides max drawdown and % stock invested periods (log scale):

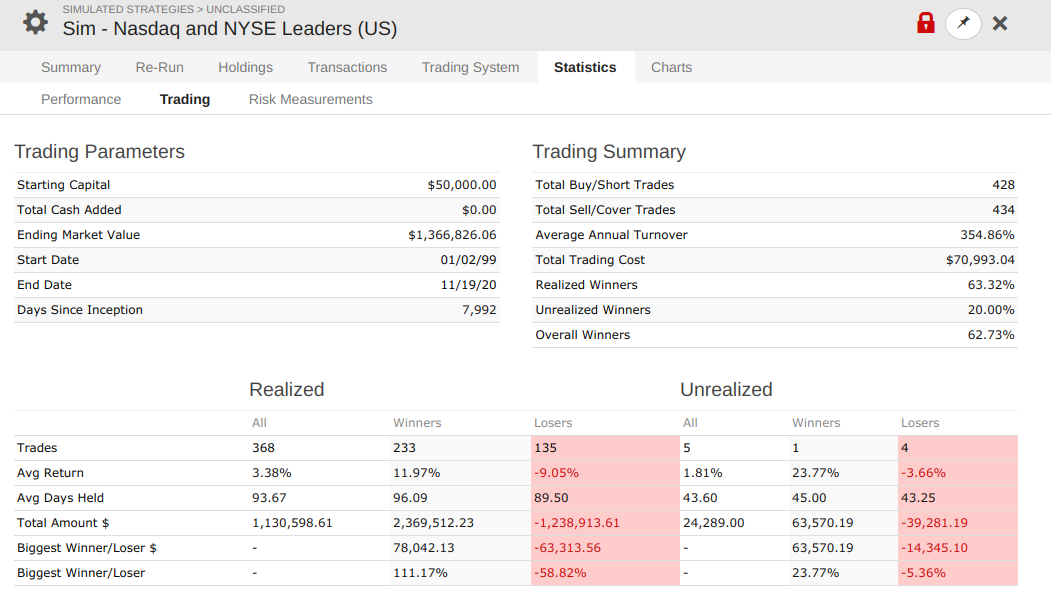
Stats information below, with winners, losers and how long typically these stocks are held for:
Below are various risk indicators as well:

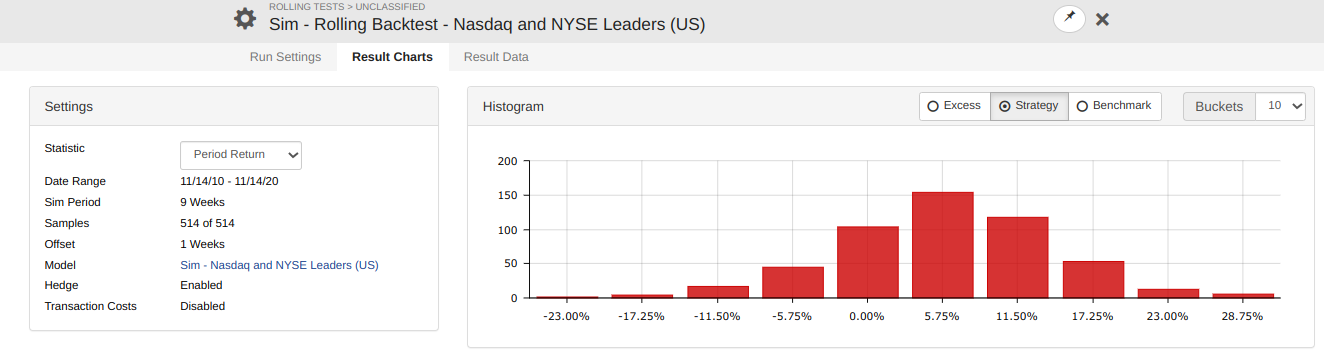
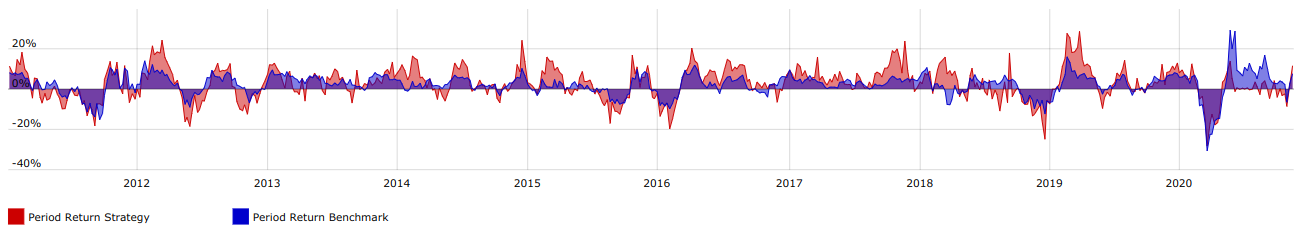
Since the model has a medium turn-over (stocks are typically held for 2 months, while most stocks closed for a loss are held for 6 weeks), the following histogram was run to evaluate how consistently the model would perform if it started at different periods (roling offset was set to 1 week, while the performance period was set to 6 weeks); below is the histogram excess performance when compared to the benchmark:

And below is the same histogram, but showing the actual model portfolio performance, instead of the excess when compared to the benchmark:
The first screening criteria is related to the market timing, to either be in equities or cash. This market timing rules use data from micro-elements (earnings and price movement trends for the whole market) as well as macro-elements, such as economic indicators (which might drive prices lower, regardless of solid fundamentals) to issue a sell all signal (move to cash) or buy according to the rules of this model.
The next screening criteria (buying as per the rules of this model) rules ensure that:
- Only growth NYSE and Nasdaq companies are chosen, based on these criteria:
- Being part of the NASDAQ Global Select Market, which consists of 1,200 stocks that meet Nasdaq’s strict financial and liquidity requirements and corporate governance standards OR being part of the NASDAQ Global Market, which defines specific standards regarding income, equity, market value and total assets / total revenue OR being part of the NYSE having an aggregate for last three fiscal years >= $10 mm, plus each of the two most recent fiscal years >=$2 mm, plus each of the prior three fiscal years >$0.
- Being publicly offered on an established American market for three months.
- Being current in regards to quarterly and annual reports.
- Not being in bankruptcy proceedings.
- Then a list of companies that make the top ranking regarding strong fundamentals is created. From a fundamentals perspective, the model relies on superior earnings yield (sustained by high earnings and sales growth), and high quality regarding return on invested capital and operating margin. Furthermore, the model looks for growing profitability rations and solid financial and efficiency ratios. It also compares how peers on same industry did and favor the companies that did better than peers and only choose companies that have been growing earnings in the past 12 months. The list is further filtered on metrics to consider valuation despite growth and estimated future business performance.
- A second list of companies that make the top ranking regarding strong technical analysis is created. From a technical analysis perspective, the model look at insider purchase trend, stock price trend, relative strength and technical indicators developed by Marc Chaikin, such as Chaikin Oscillator (based on momentum of accumulation / distribution index, which relates price and volume and acts as a leading indicator of price movements), and Chaikin Money Flow (based on money flow volume, which uses the concept that buying support is normally demonstrated by increased volume and repeated closes in the top half of the daily range and that selling pressure is shown by increased volume and recurrent closes in the lower half of the daily range, producing a picture of how money is flowing into or out of a stock). The list is further filtered on metrics regarding quality (sound balance sheet and income statement metrics, with added weight on positive revised guidance).
- Only the companies that rank high on both ranks are chosen to build a final list.
- Once the final list of stocks are found, then they are ranked from best to worse, where only the top ranked are chosen. The ranking is based on a mix of fundamentals and technical analysis combined, to determine the stocks with best balance between quality and momentum.
In order to keep momentum of the portfolio, sell rules are triggered when a company leaves the top ranking or when a company crosses a threshold for profit taking or stop losses (rebalanced weekly). The model also make use of market timing rules to switch to other asssets when the economic cycle stops favoring equities over fixed income type of asset.
In parallel to the rules above, the model is also hedged with an ETF taking momentum into account to further leverage or control risk exposure.
Subscribe to this model
Interested in subscribing to multiple models? Discounts are available when subscribing to 2 or more models. Simply subscribe to your first model and then let us know which model you want to subscribe next, and we’ll send you a discount coupon.
Discount rates:
| 1st model | full price |
| 2nd model | 10% discount (applied to the 2nd model) |
| 3rd model | 20% discount (applied to the 3rd model) |
| 4th model | 30% discount (applied to the 4th model) |
| 5th model | 40% discount (applied to the 5th model) |
| 6th model | 50% discount (applied to the 6th model) |
| 7th model | 60% discount (applied to the 7th model) |
| 8th model | 70% discount (applied to the 8th model) |
Got questions? Check our Frequently Asked Questions for Premium models or contact us.
Already a member?
Performance Info:
(last updated on July 12, 2026)
Loading Viewer...
Cost of this model: $36 / month. Cancel anytime.
Interested in subscribing to multiple models? Discounts are available when subscribing to 2 or more models. Simply subscribe to your first model and then let us know which model you want to subscribe next, and we’ll send you a discount coupon.
Discount rates:
| 1st model | full price |
| 2nd model | 10% discount (applied to the 2nd model) |
| 3rd model | 20% discount (applied to the 3rd model) |
| 4th model | 30% discount (applied to the 4th model) |
| 5th model | 40% discount (applied to the 5th model) |
| 6th model | 50% discount (applied to the 6th model) |
| 7th model | 60% discount (applied to the 7th model) |
| 8th model | 70% discount (applied to the 8th model) |
Got questions? Check our Frequently Asked Questions for Premium models or contact us.
Is there a minimum investment amount you would recommend for this model?
I believe that one should allocate a minimum of $1,000 per stock, and considering that the model holds up to 7 stocks, I would start with $7,000. This model is focused on Nasdaq stocks, and Nasdaq has few examples of stocks where $1,000 would barely buy 1 share, like AMZN, GOOGL or PCLN.